Hiring managers screen for these AI skills in data & analytics job postings. Ranked by frequency, with the time it takes to get usefully fluent in each.
The skills below are the ones that hiring managers screen for in data & analytics job postings, ranked by how often each one shows up in our 22,351-job-posting dataset.
The bigger picture: Pick one of three lanes: applied AI engineering (RAG, agents, evals), modern ML (fine-tuning, post-training), or analytics engineering with AI-assisted workflows. Each lane has a clear progression and clear comp band. Generalists are at most risk; specialists with shipped production work are at the top of the market.
The Skills
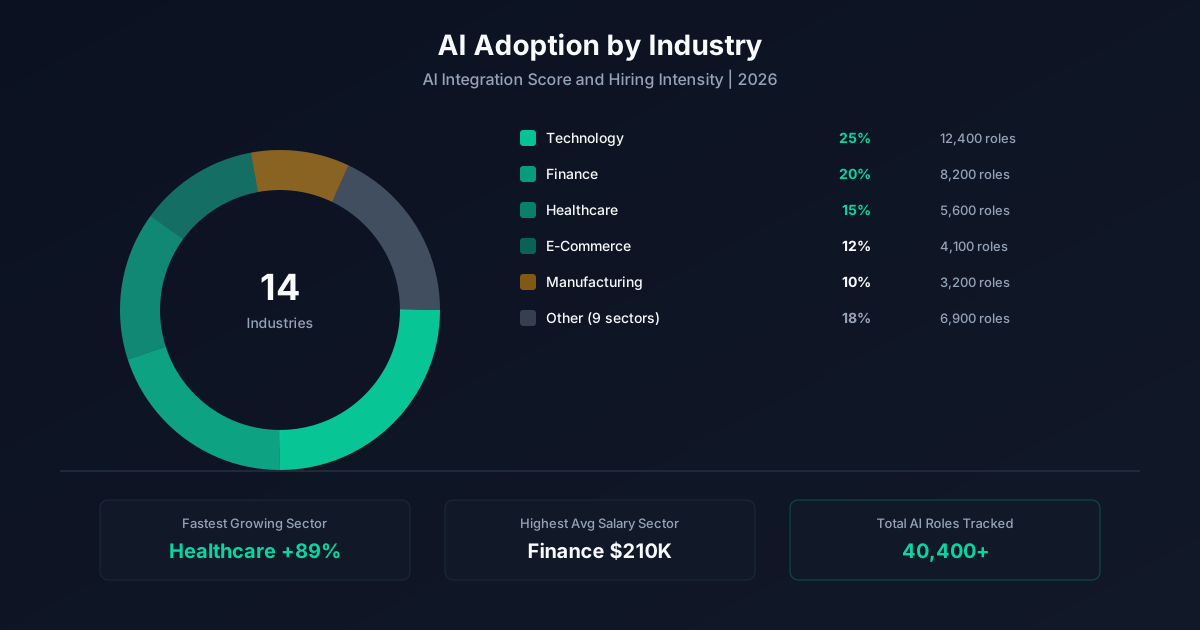
These skills appear repeatedly in data & analytics job postings that mention AI. We tracked them across 3,435 live postings on AI Pulse. The list is ordered by frequency.
RAG is the #1 skill in data & analytics AI jobs. Build systems that combine LLMs with your company's data.
Time to fluency: 4-6 weeksFor data scientists moving into AI, PyTorch is the standard framework for building and fine-tuning models.
Time to fluency: 6-8 weeksAdapt pre-trained models to your domain data. Learn evaluation frameworks to measure model output quality.
Time to fluency: 4-6 weeksRAG is the #1 skill in data & analytics AI jobs. Build systems that combine LLMs with your company's data.
Time to fluency: 4-6 weeksAdjacent Skills
Once the core skills are in place, these are the next moves. They show up less often in postings but compound the value of the core stack.
RAG is the #1 skill in data & analytics AI jobs. Build systems that combine LLMs with your company's data.
Time to fluency: 4-6 weeksFor data scientists moving into AI, PyTorch is the standard framework for building and fine-tuning models.
Time to fluency: 6-8 weeksUse AI to write SQL, generate visualizations, explain statistical results, and draft analysis reports.
Time to fluency: 1-2 weeksAdapt pre-trained models to your domain data. Learn evaluation frameworks to measure model output quality.
Time to fluency: 4-6 weeksHow To Demonstrate Skills
"I've used ChatGPT" doesn't read as AI skill to a hiring manager. What does:
The bar isn't ML expertise. It's evidence you've moved from playing with AI to producing with it.
Where To Start
Pick the top-ranked skill above. Find one task you do every week in your data & analytics workflow. Build an AI-assisted version of it. Document the time saved, accuracy delta, and what broke. That's now your interview story and your portfolio piece in one weekend.
Walk through the full sequence on the 6-week learning plan, or jump to the tools page to pick your starting tool.
A Worked Example
Here's how those skills compound in real work for an AI-augmented data & analytics pro:
A senior data scientist at a logistics company shipped a RAG system over the company's incident reports, runbooks, and on-call documentation using LangChain plus Pinecone. On-call engineers query the system in Slack to get prior incident context in seconds instead of minutes. Mean time to recovery dropped from 47 minutes to 22 minutes over a quarter. The scientist published a writeup that drew offers from three AI-native scale-ups.
The pattern matters more than the specific tools or numbers. Documented work, measurable outcomes, and a story you can tell externally are the three things that move data & analytics pros from median to top quartile in 2026.
Putting It Together
Skills is one piece of the AI-for-data & analytics story. The full picture covers what AI is changing about the work (the risk page), the skills employers want (the skills page), the tools AI-fluent pros use (the tools page), what the work pays (the salary page), where the hiring is happening (the jobs page), the curriculum to close any gaps (the learn page), and the career path that connects them (the career page).
Most data & analytics pros end up reading three or four of these pages before they make a move, because the questions are connected. The skills you need depend on the role you're targeting; the salary band depends on the seniority and company type; the curriculum that gets you there depends on what you're starting from. The hub at /ai-for-data-analytics/ ties the pieces together with the strategic synthesis: what's actually happening in data & analytics, what to do about it, and how to think about your next move.
If you're early in the process, start with the risk page for the honest read on what AI is and isn't changing in data & analytics. If you're closer to a job move, the jobs page and career page are the highest-impact reads. If you're trying to grow inside your current role, the learn page is the practical sequence.
Common Questions
The questions below come from data & analytics pros at every stage, junior to executive. If you don't see yours, the related pages link out to the deeper coverage on each topic.
The top skills are RAG, PyTorch, Fine-tuning, LLM Frameworks. AI Pulse tracks these across 3,435 live job postings weekly. Most data & analytics job listings don't require deep ML expertise. They want working fluency with AI tools used inside the function.
Most data & analytics pros can be interview-credible in 4-6 weeks of focused practice. Start with the highest-ranked skill in this list, build one workflow you can demo, and document the before-and-after.
Usually no. Most data & analytics AI work uses GUI tools and prompts. Python helps if you want to move into AI engineering. For most function-specific roles, skip Python until you've covered the workflow tools.
Skills that solve a measurable business problem pay the most. In data & analytics, that usually means the skills tied to revenue, customer experience, or efficiency metrics. The list above is ordered by demand frequency, which correlates with pay.
A documented workflow showing time-saved, quality-delta, and the failure modes you mitigated. One deep example beats a list of tools you've touched. Hiring managers want evidence of judgment, not exposure.
Keep Going
The pages below cover the rest of the picture. Each one is a self-contained answer to a different long-tail question. Most data & analytics pros end up reading three or four before they apply somewhere or make their next move.
Methodology
Every number on this page comes from a continuously updated dataset of 22,351 weekly job postings across 42 roles and 14 industries. Salary figures are derived from postings that disclose compensation and weighted by seniority, location, and remote status. AI penetration percentages reflect the share of postings in each function that explicitly require or prefer AI skills. Premium calculations compare median compensation for postings tagged AI-skilled against postings in the same function and seniority without AI requirements. The dataset refreshes every Sunday; the snapshot used for this page is dated the week shown above.
Sources & notes. Source dataset: AI Pulse weekly job posting index (n=22,351). Salary disclosure rate: 6.4% of postings include compensation. Premium calculations require minimum n=20 postings per role-seniority cell. Updated weekly. For methodology questions, see the About page.
Last updated: 2026-08-24.
One email a week. AI adoption data, salary shifts, and the skills worth learning. No fluff.
Subscribe Free AI Pulse